


Visualization only works when people understand it and act on it
Turning 100+ pages of printed reports into data commercial and
C-level teams used to decide, across a national retail network.
ROLEProduct Designer to
Sr. Product Designer
TEAM1 PM, 1 front-end, 1 back-end, 1 tech lead, 1 data scientist,
1 data engeneer
TIMELINE
2 years
Context
Bússola is a data visualization and business analysis platform developed for the C-Level Executives and the Comercial team at Grupo Boticário. I joined the project as a Product Designer with a clear mission: rebuild the platform’s structure and usability, translating complex business metrics into an intuitive experience that empowers decision-making at all levels of the company.
Before Bússola, executive visits to retail stores were highly manual. Each visit required over 100 pages of printed reports, prepared specifically for each point of sale. Since executives visited multiple stores across the year, this effort was repeated several times, involving at least three different teams just to generate the materials.
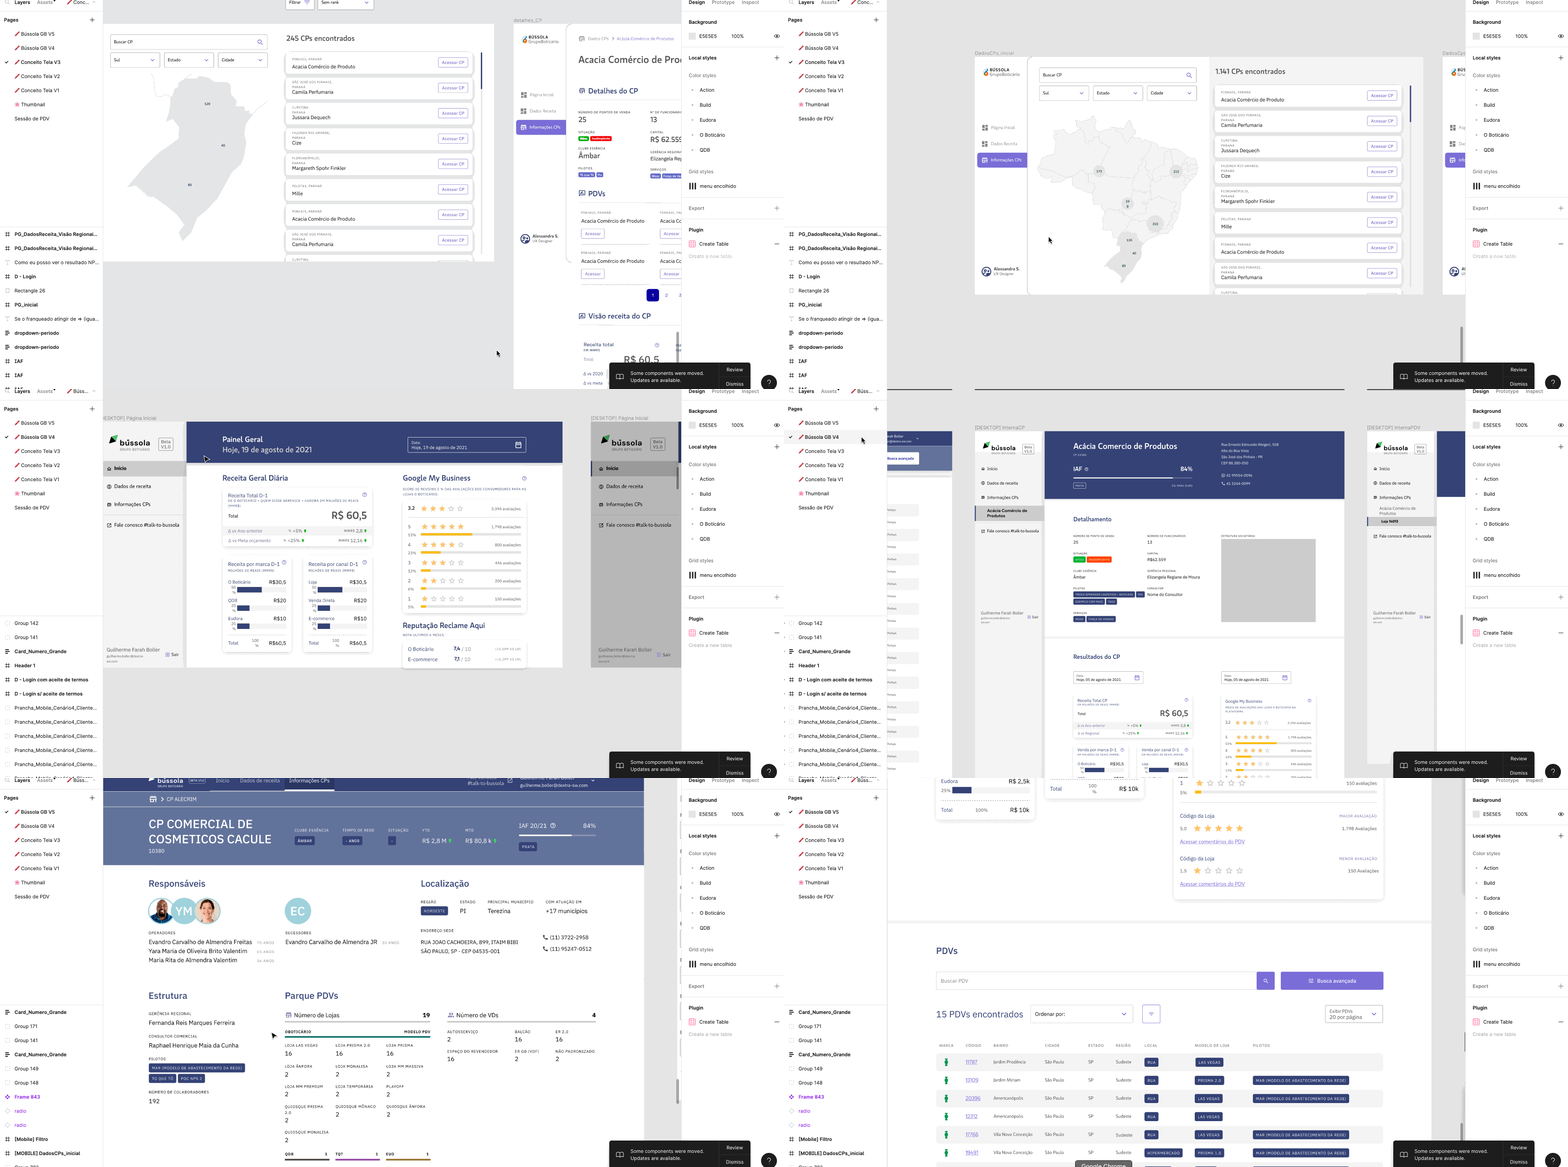
Image 1: GIF showing the product evolution, version 3 to version 5.
This process was not only time-consuming and unsustainable but also fragmented the strategic view of store performance.
Bússola was created to solve this. The first version of the tool, designed during the pandemic, focused on enabling remote store visits. However, after I joined, we pivoted the product to better support in-person visits and business performance analysis, combining sales data, brand segmentation, franchise performance, and store-level KPIs into a single platform.
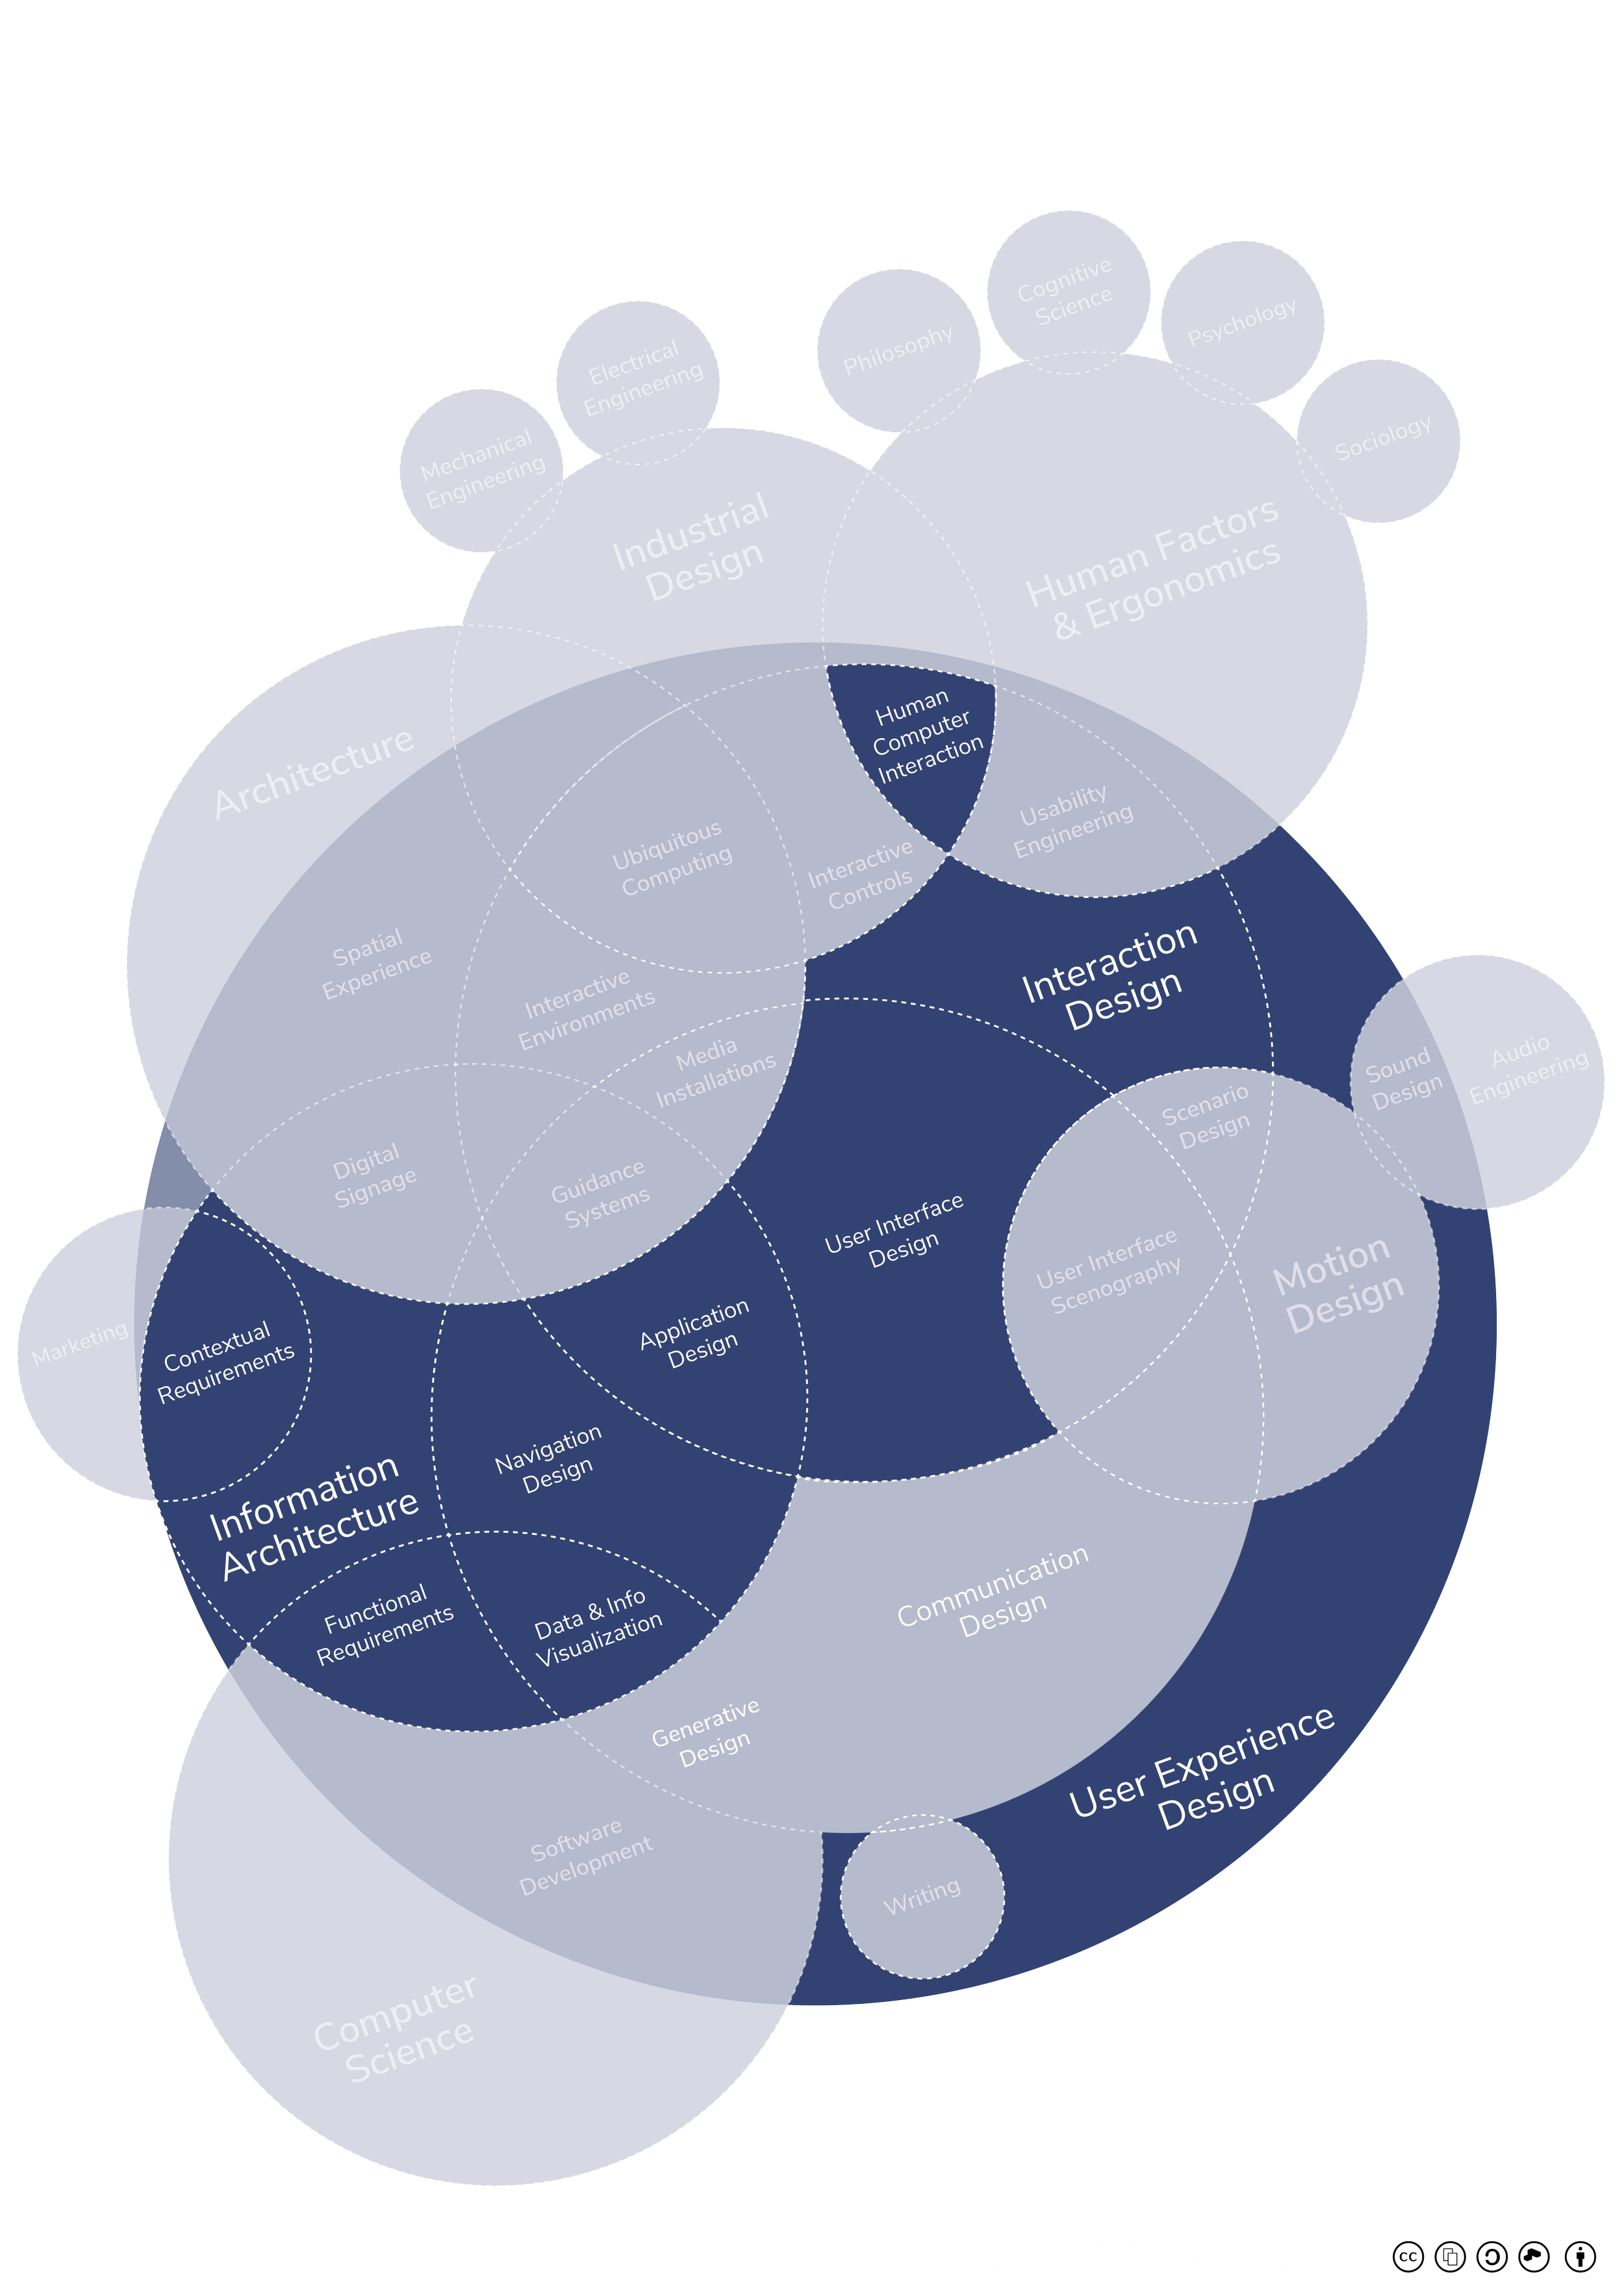
Image 2: Dark blue representing the areas of UX I worked on.
Design Approach
I joined the team as the Product Designer, working alongside PMs, engineers, and key business stakeholders, including the CEO.
My role covered research, UX architecture, design of dashboards and visual components, and aligning business complexity with usability
Led the redesign of the platform's information architecture
Created custom data visualization components outside the existing design system
Facilitated alignment between stakeholders, developers, and business teams
Mapped internal business rules and translated them into interactive UI patterns
Defined user profiles to balance simplicity and depth across the experience
Designed a scalable MVP that later became a strategic ecosystem for Grupo Boticário
Design Challenges & Solutions
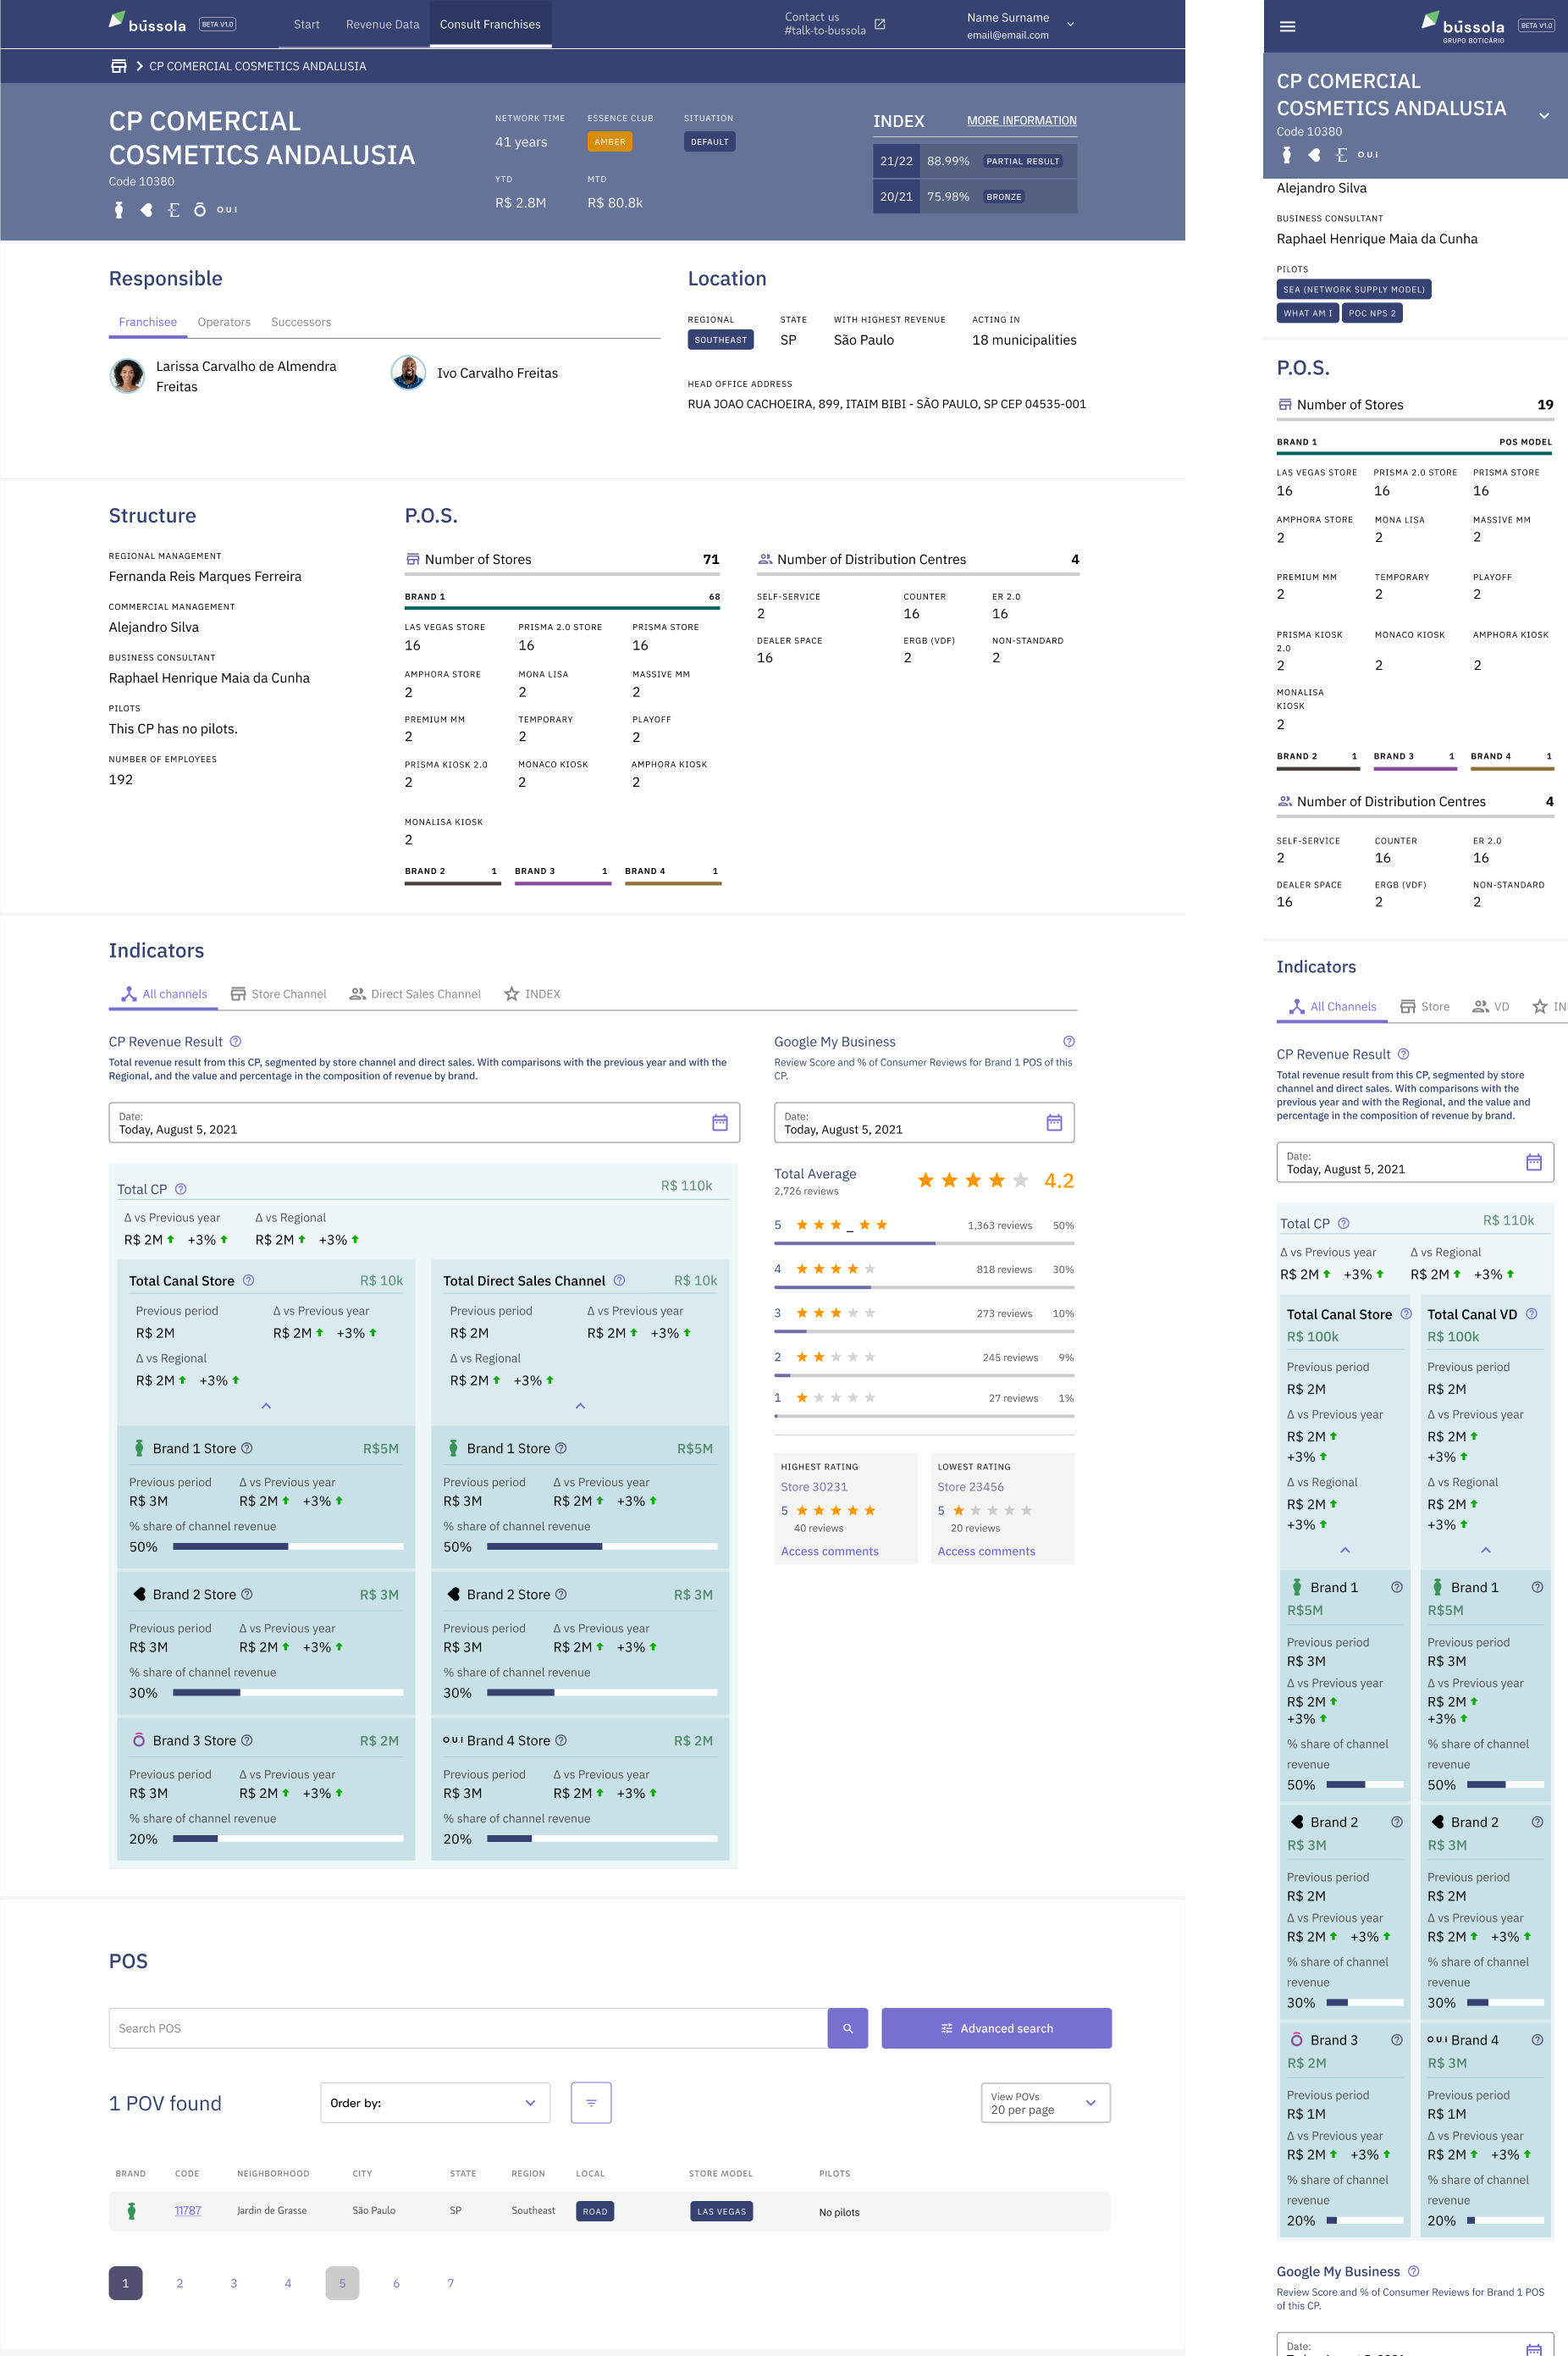
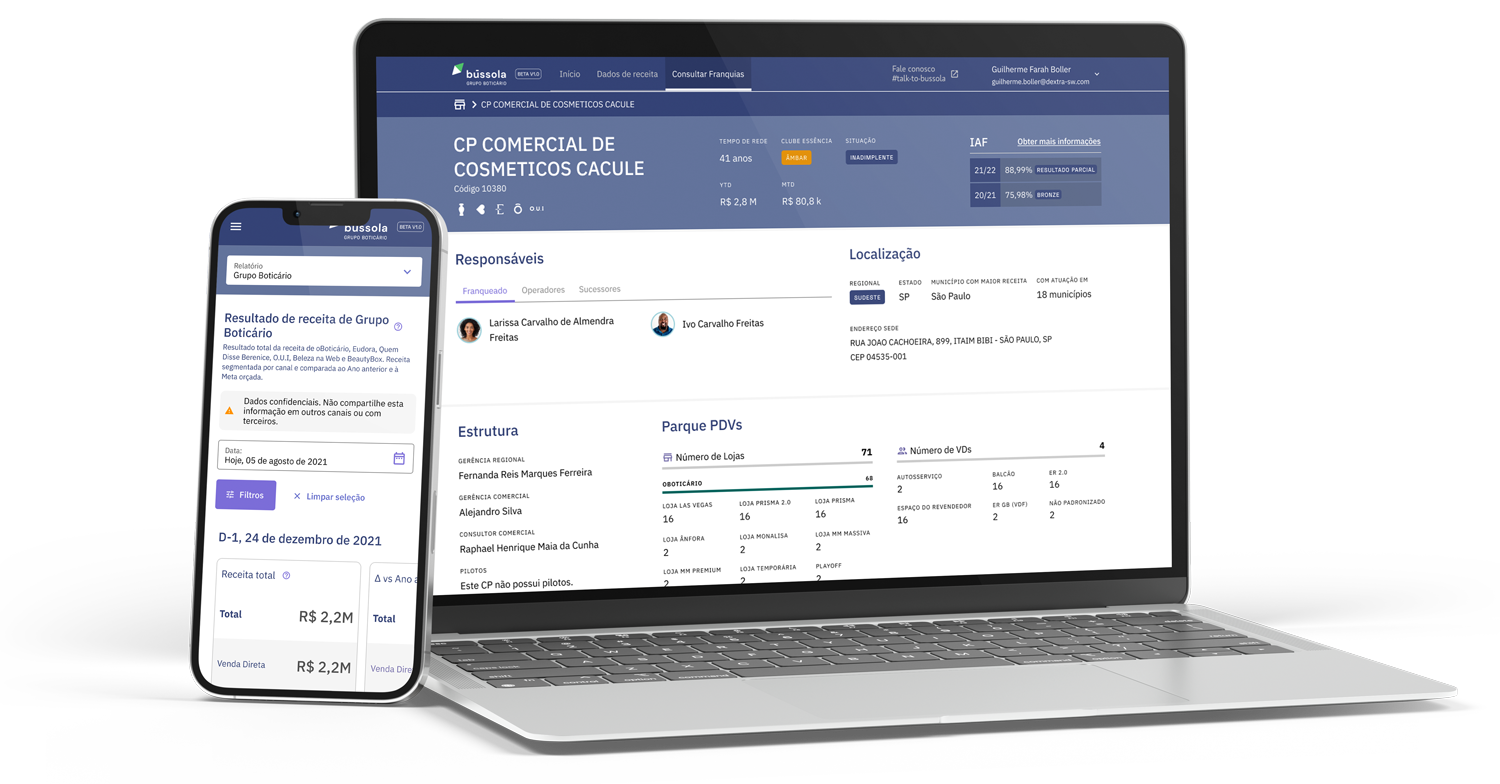
Image 3: Desktop and mobile screens showing the main interface of Bússola where you can identify business indicators with tables and infographics.
Rebuilding the Information Architecture
The original platform structure was not aligned with user goals or the business model. I worked alongside the product team to map user journeys and define a new architecture that could support different store hierarchies (e.g., CPs and PDVs — “Parent Codes” and “Points of Sale”), brand filters, and business logic.
The new structure included:
Executive overview with macro indicators segmented by brand
Sales dashboards with multi-dimensional filters (region, state, brand, time)
CP pages with franchise-level KPIs, including sales, satisfaction ratings (from Google My Business), and performance metrics
PDV pages with individual store indicators and benchmarks
This allowed the executive and commercial teams to access the right level of detail depending on their needs.
Designing for Data Clarity and Context
One of the most complex aspects of the platform was the presentation of business KPIs, such as IAF, an internal metric that defines if a store is gold, silver, or bronze. These indicators were not universally understood across the company.
To support user understanding:
I used official internal documentation as a single source of truth
Added tooltips and description popovers explaining what each metric meant and why it mattered
Followed principles from the book Storytelling with Data to build readable, clean tables and charts
Ensured that all tables were initially unfiltered, giving users the control to personalize their view
Navigating Stakeholder/User Overlap
Our main stakeholder was the executive board, including the CEO, who were also the primary users of the tool. However, since we couldn't interview them directly, I worked with their closest collaborators (often senior managers) to understand their needs and workflows.
From this, I created three user profiles to guide design decisions:
Profile 1: Executives, high-level users with strategic focus
Profile 2: Senior Managers, users with partial data fluency, focused on specific areas
Profile 3: Operational Users, coordinators, product managers, developers with low exposure to business data
All visual and interaction decisions were driven by Profile 3 (least familiar with data), to ensure clarity and accessibility. Meanwhile, the data depth and complexity were aligned with Profile 1 (executives), ensuring that no strategic insight was lost.
Adapting to Different Backgrounds
We noticed that executives compared Bússola to Excel, as this was their reference for working with tables and dashboards. Others, especially from product or technical teams, had little familiarity with spreadsheets.
To bridge that gap, I:
Used Excel-like patterns (e.g., tabs, filters, cell structures) as visual metaphors
Simplified UI components for ease of navigation
Created a modular dashboard with progressive disclosure: advanced filters and metrics appeared only when needed
This approach allowed us to create a unified product experience, even for users with very different analytical backgrounds.
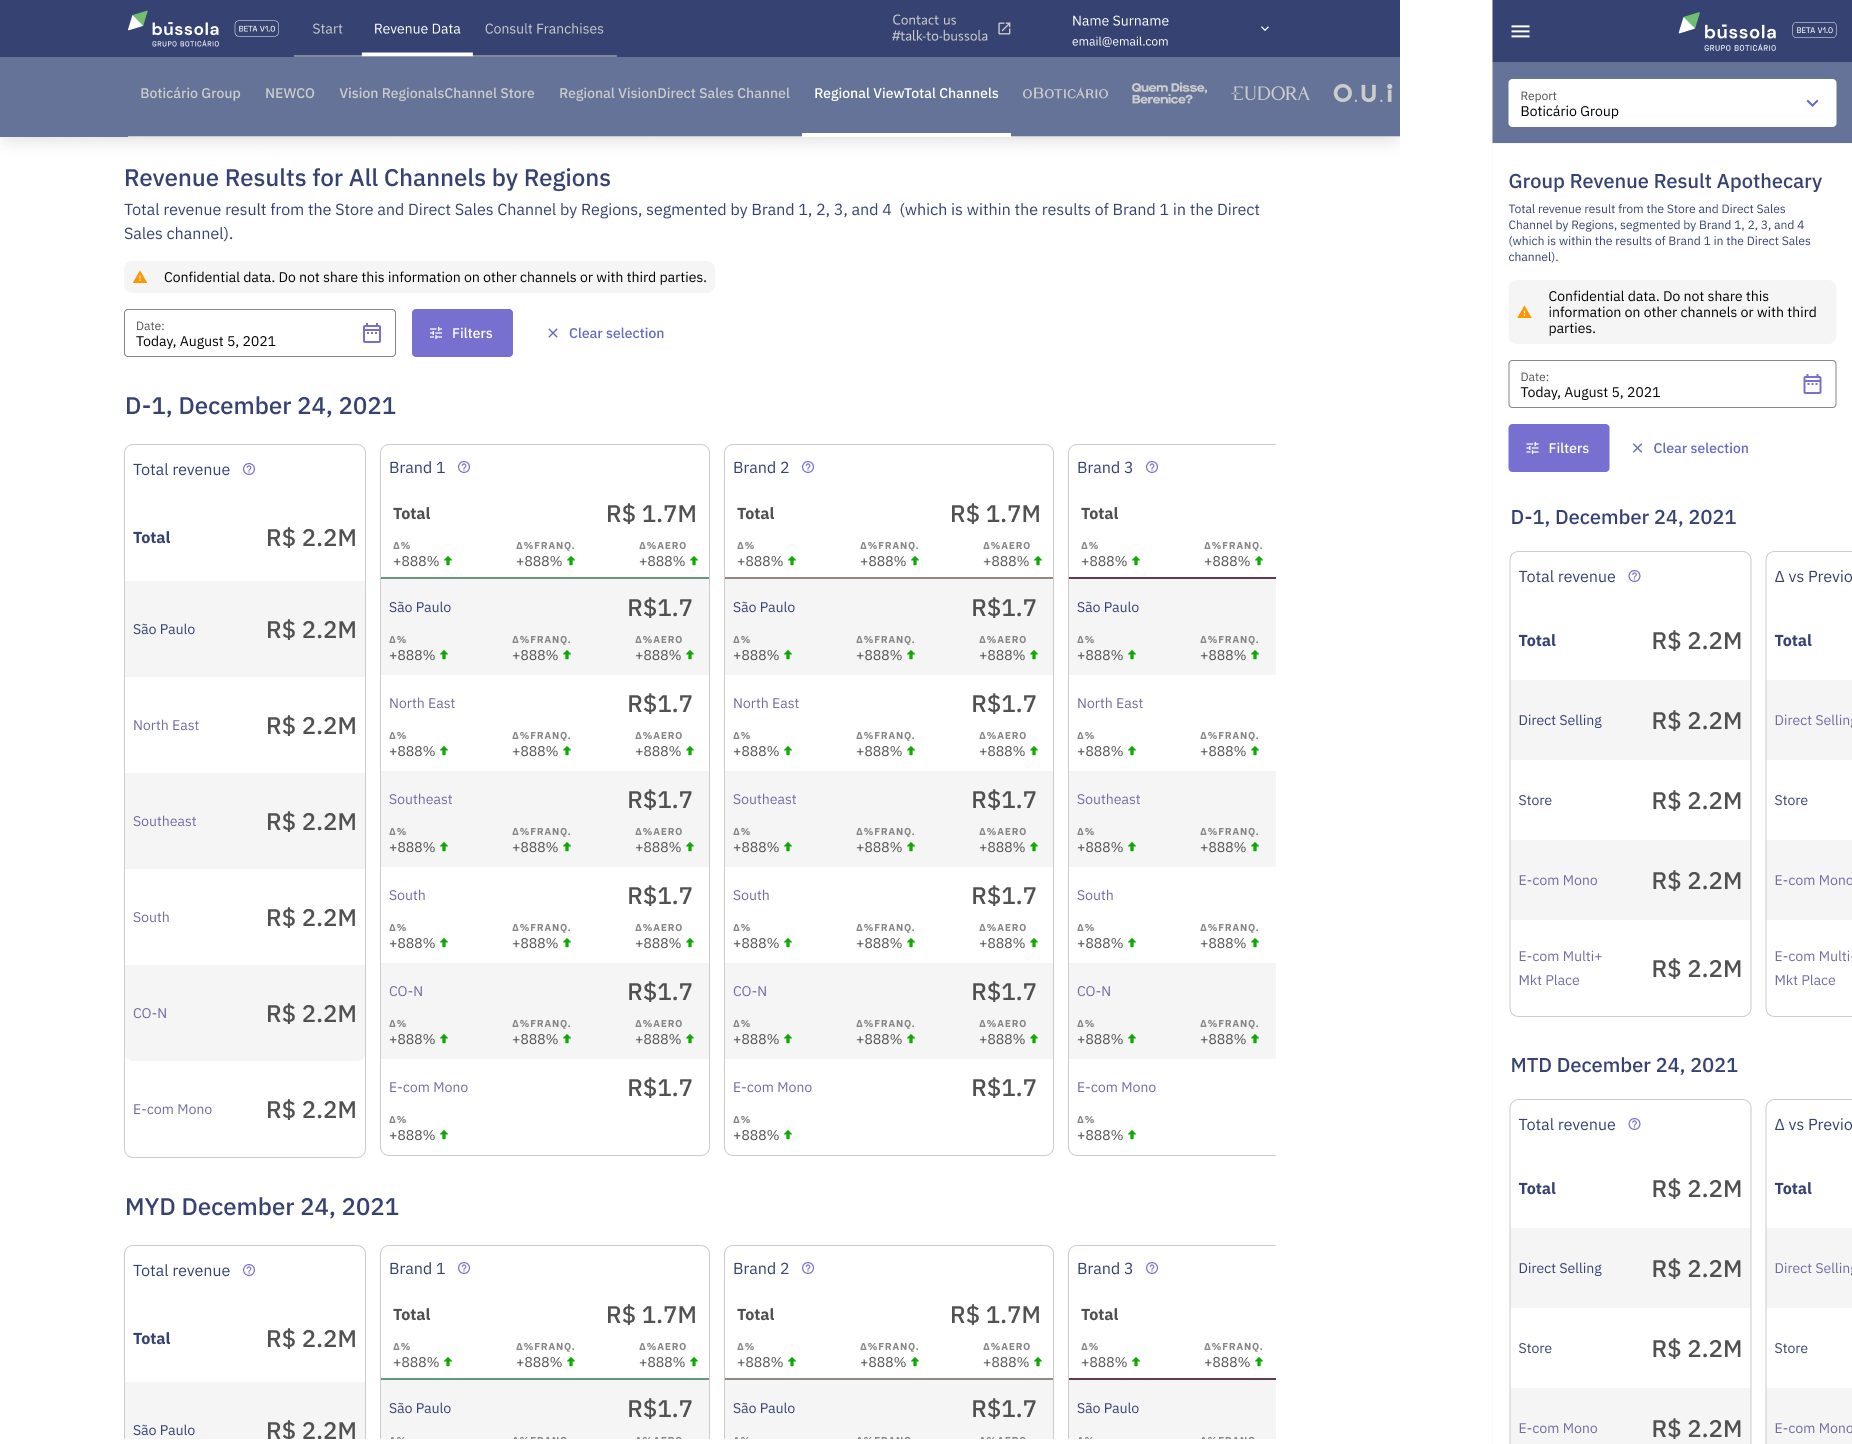
Image 4: Desktop and mobile screens showing the other interface of Bússola where you can identify business indicators with tables and infographics.
Testing & Validation
Conducted user interviews and usability tests with Profiles 2 and 3 (Senior Managers and Operational Users)
Validated all indicators using internal definitions from Grupo Boticário’s documentation
Adjusted visual hierarchy and interactions based on feedback from real use cases
Delivered prototypes to stakeholders for review and refinement throughout the MVP process
Results
MVP delivered in 1 month, presented to 50 users across executive and commercial areas
Continuous iterations based on feedback led to higher adoption
Bússola evolved into a core ecosystem for the Commercial team
Reduced the need for 100+ printed reports per store visit to a single, digital tool
Recognized by stakeholders, including the CEO, as a strategic product
Enabled Commercial teams to use Bússola daily, even beyond store visit planning
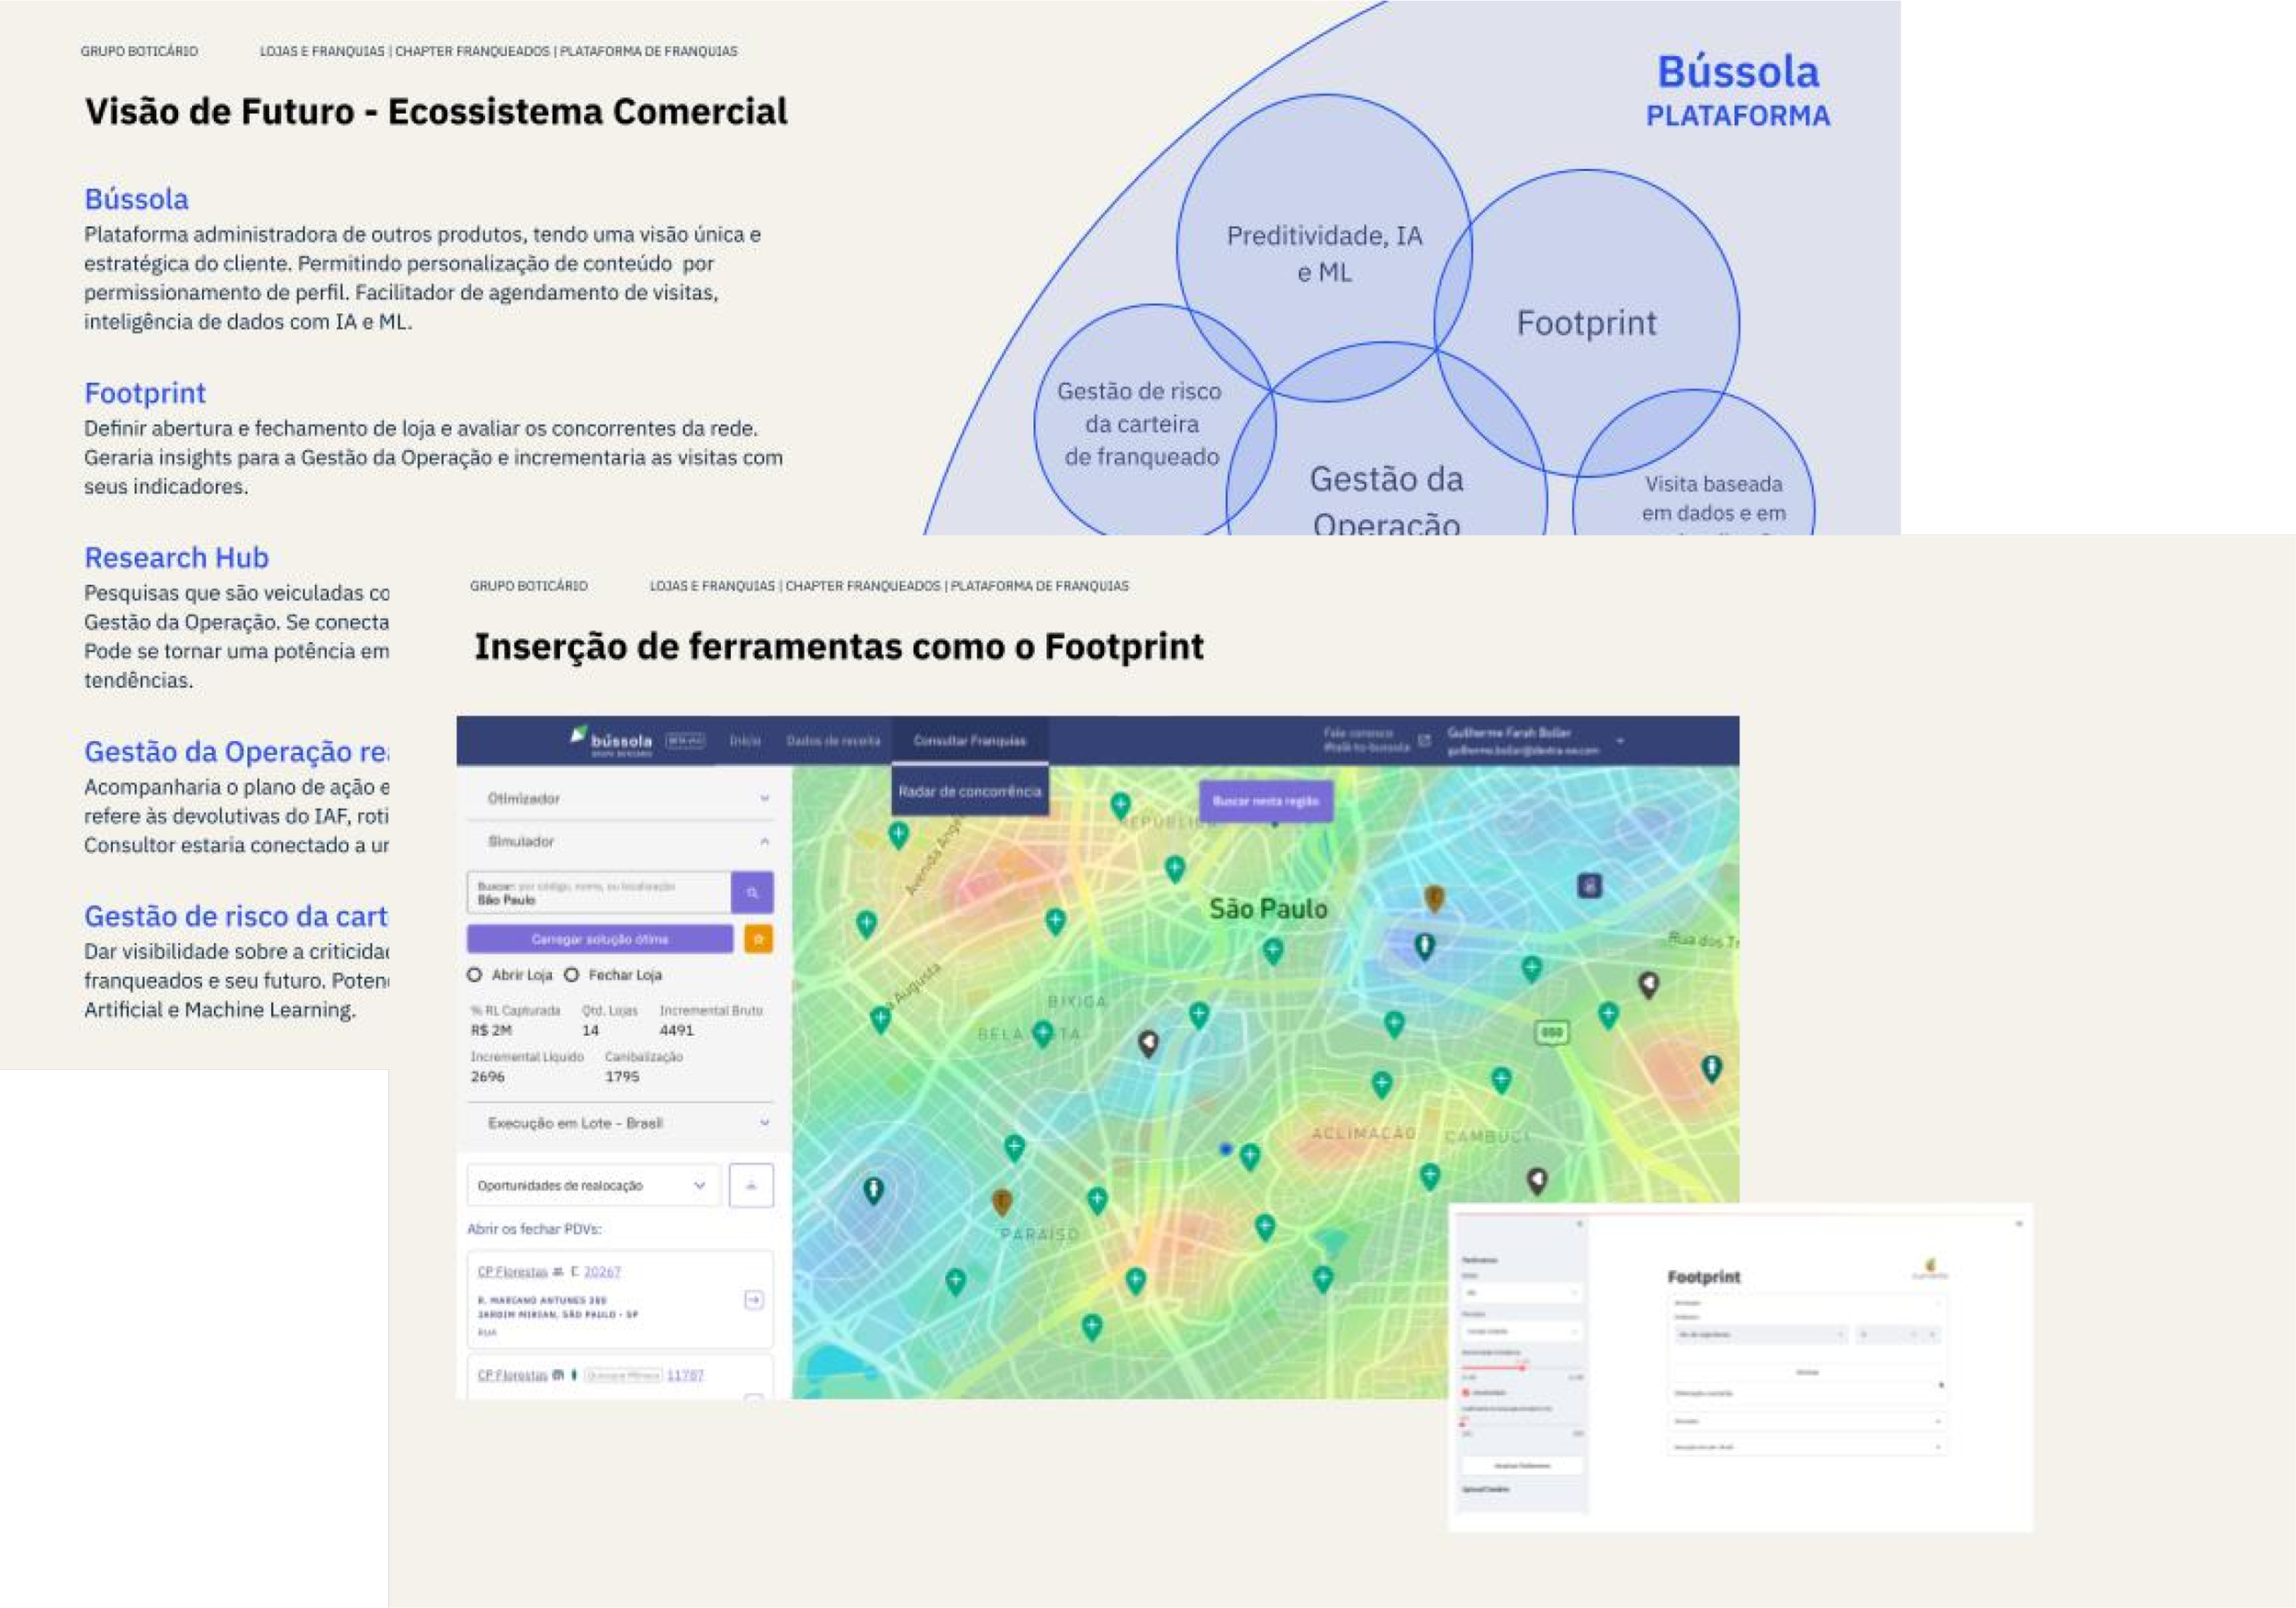
Image 4: Ideation for the future of Bússola as a Ecosystem of products.
Final Thought
Bússola transformed how Grupo Boticário’s teams — from executives to field staff — analyzed performance and made strategic decisions. My work went beyond visual design: it was about building a bridge between complexity and clarity, and enabling people to work smarter, not harder. What started as a dashboard became a high-impact ecosystem, used daily by decision-makers across the organization.
Coworkers Feedbacks
“You stand out for:
Assertive communication: in critique and/or stakeholder and user agendas, their statements and the positive impacts they had were evident.
Organization and structuring of ideas.
Generation of solid ideas and proposals for product evolution, future product evolution.
Super proactive, engaging, and motivating the team: in dailies and refinement agendas.
Sharp vision for the strategy not only of the product but also of the company. Some examples include the creation of executive materials that were praised by the company's board and also received invitations to participate in discovery and cross-critique agendas."
— Product Manager
"You are highly engaged in the sense that you truly strive to deliver the best possible work.
You participate with interest in all our meetings and always bring up relevant ideas.
It's very easy to work with you as you are a very friendly and kind person. The meetings are very relaxed and always have a proactive tone.
Your listening skills are very open, so I feel like we always build things together."
— Product Designer
"The organization and creation format within Figma, making it clear what we have for development and what we have in progress.
I can also highlight your sense of teamwork and willingness to create, modify, and contribute.
Gui always brings improvements to the team but also invites us to participate and exchange ideas.
When asked for an improvement, he willingly makes them as soon as possible, juggling between attending to the development and product teams."
— Front-end Developer